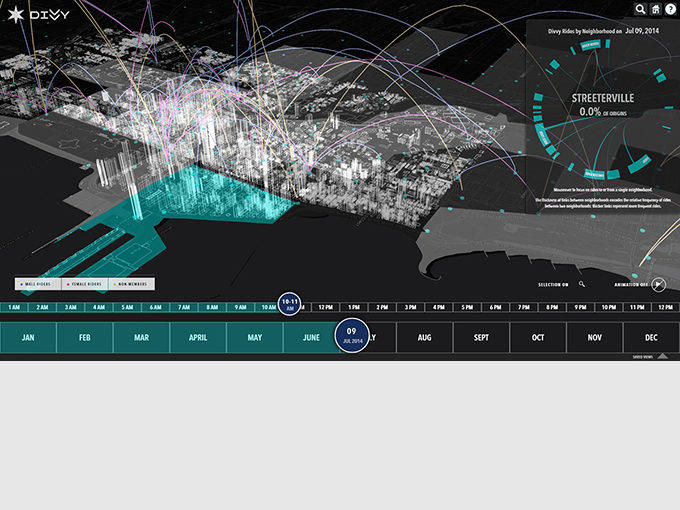
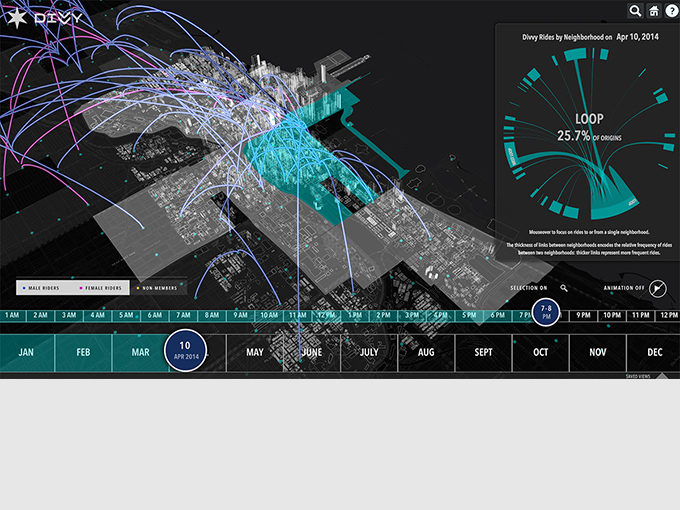
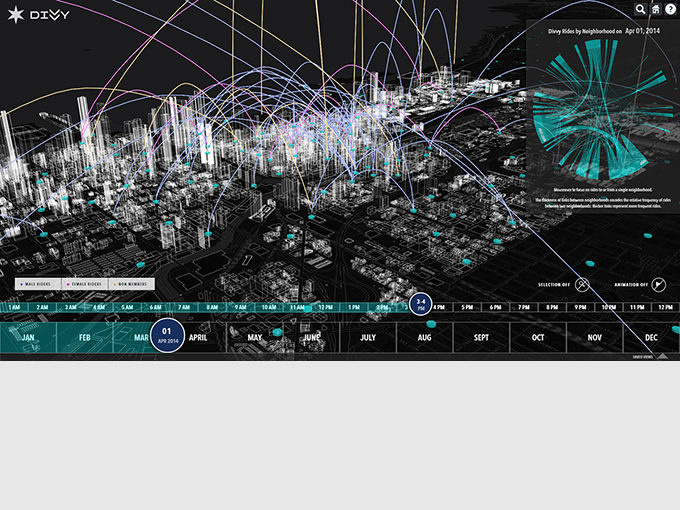
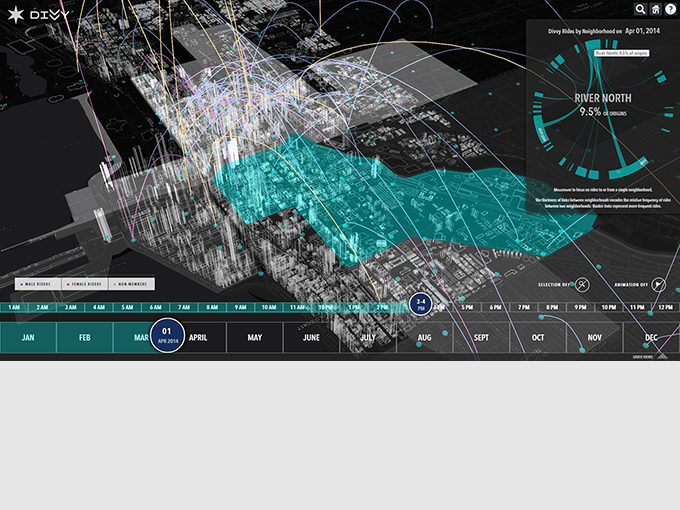
Big data presents tremendous opportunities to inform urban design, but raw data provides little useful insight. Divvy, a bicycle sharing program used in Chicago, recently launched a Data Challenge in which it asked designers, developers, and scientists to visualize the more than 3.2 million Divvy bicycle trips taken in 2014.
Matt Shaxted, computational designer in SOM’s Chicago office, created a 3D interactive visualization. Curves are used to display hourly trips between stations and a chord diagram communicates daily flow between neighborhoods. Twelve finalists have been selected and Shaxted’s visualization is a finalist in the “Most Beautiful” category. Explore Matt’s entry at divvy.vision and visit Red Eye Chicago to vote through April 7, 2015.